Maxam Diversified Strategies Fund – Q3 2023

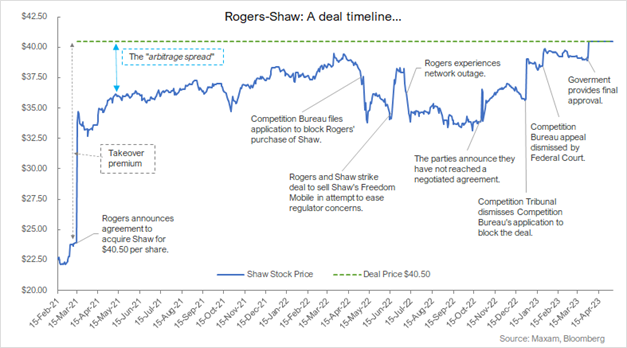
M&A activity highlights the value disconnect.

Maxam Diversified Strategies – Q3 2023 Commentary

Dear fellow investors,

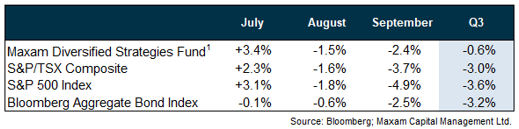
The Maxam Diversified Strategies Fund1 declined -0.6% in the third quarter of 2023.

Q3 was a difficult quarter for both equity and bond markets. After a positive start to the quarter, the now all-too-familiar market narratives of high inflation, rising interest rates, recession fears and geopolitical conflicts began to dominate again. If that wasn’t enough, late August through early October is often the weakest seasonal period for equities each year.

As we finish the weakest seasonal period of the year, we enter the strongest seasonal period through year-end. A year-end rally would be very welcome of course – but whatever transpires it seems appropriate to expect continued market volatility in the near term.

You know those Buffett quotes that everyone loves?

The wall of worry is steep today. It is understandable, there is a lot to worry about with respect to the capital markets, the economy, and the world. And worry brings opportunity – companies are not cheap when everything is rosy and reflected in stock prices.

Framing part of the opportunity set: it has been a terrible market for small and mid-cap stocks over the last couple of years. The Russell 2000, S&P 600, and S&P/TSX Small Cap are down -31%, -25% and -23% since November 20212.

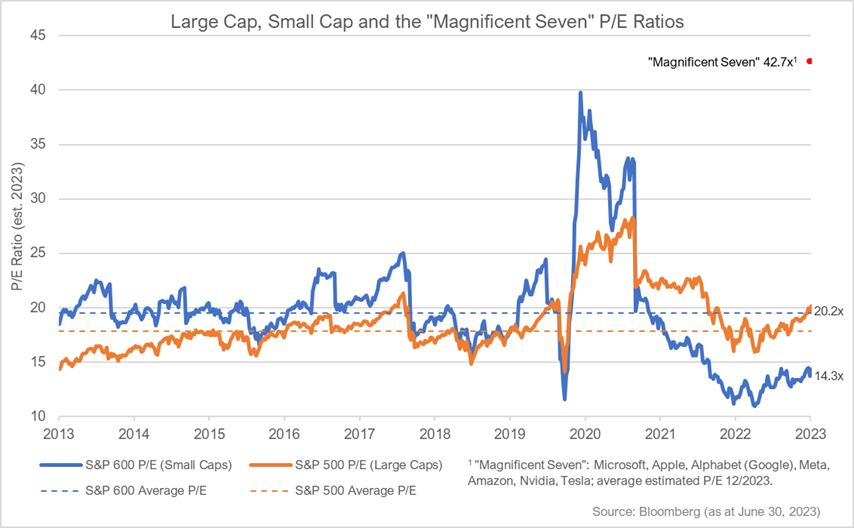
And it’s not just small and mid-caps. The S&P 500 Equal Weight Index is down -15% over that same time frame2. In our Q1 and Q2 commentaries we discussed the narrow breadth of the market this year and how a few mega cap companies were masking the weakness and opportunity beneath the surface.

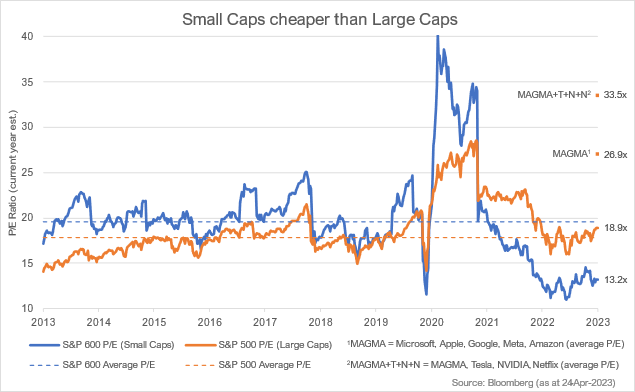
Like a broken record, we have also been highlighting that small and mid-cap securities currently trade at a material valuation discount to large caps. Small caps have historically traded at a valuation premium to large caps, but they have shifted to a discount because as a group they are perceived to be more sensitive to the economy, inflation, and interest rates.

A recession may be a matter of ‘when’ not ‘if’ at this point – in any event, we see one already reflected in many security prices today. History reveals that markets are forward discounting mechanisms – and small caps typically outperform as inflation declines, interest rates fall, and the economy troughs and exits a recession.

Today we have an environment characterized by fear and an opportunity set full of securities that are down materially from their highs, trading at attractive valuations.

Take advantage. Be greedy when others are fearful.

There must be something in the water.

We have mentioned our investment in water infrastructure and technology company H2O Innovation in our quarterly commentaries on five previous occasions. On four instances we noted that it was a positive contributor to performance, and once that it was a negative contributor.

In our Q2 2022 commentary, when H2O was a detractor from performance, we wrote:

We’ve recently added to our position in H20 Innovation Inc., a water infrastructure and technology company whose shares were down -32% through the first six months of this year. We like this founder led business that has highly recurring revenues and is delivering strong organic and acquisitive growth.

Our intention was to highlight that we were adding to a high-quality and growing business that was trading at what we thought was an unreasonably depressed share price. And in our most recent commentary – yes just a few months ago – we took a small victory lap when H2O’s shares, reflecting the strong performance of the business, performed quite well.

Fast forward to the quarter that just finished on September 30th: H2O’s share price declined from $3.20 to $2.61, down -18%. Stock prices are volatile – often much more so than their underlying businesses.

We were preparing to write about the opportunity to add to this quality business again… H2O was performing quite well but getting no love from investors – albeit in a very difficult market environment, particularly for stocks not named NVIDIA or associated with the recent AI mania3.

On October 3rd H2O announced that they had entered into a definitive agreement to be acquired by Ember Infrastructure Management, a New York-based private equity firm, for $4.25 cash per share – a significant premium to where the public market was valuing the business.

Beyond H2O being a successful investment for the fund, it is illustrative of the value disconnect that exists for select companies in this market environment, and the opportunity that exists for investors.

With many quality small and mid-cap companies trading at unreasonably low valuations, or material discounts to their larger peers, we expect to see an uptick in M&A activity. Either the market will provide deserving businesses with a reasonable valuation, or an opportunistic acquiror will.

Exposures.

At the end of the third quarter the fund was well diversified across 11 industry sectors and its top 25 positions accounted for approximately 51% of net assets. From a strategy perspective, fund exposures include 66% in fundamental longs, 28% in special situations, 4% in convertible debentures, 12% in arbitrage, and approximately 2% gross exposure in short positions.

Positive contributors to fund performance during Q3 included Vitalhub, Celestica, NexGen Energy, Sprott Physical Uranium Trust and AG Growth International. Some notable detractors from performance in the quarter included H2O Innovation, Calian Group and Hamilton Thorne.

We have more value and catalyst rich names like H2O Innovation in the fund today.

Redux

There is compelling value beneath the surface of the mega cap companies that have garnered the preponderance of investor attention this year. Looking beyond any near-term volatility I see one of the best set ups for our style and approach since 2000 and 2009.

In 2000 the internet and technology bubble was bursting, former darlings declined and previously ignored companies and segments of the market began a period of significant outperformance.

In 2009, fears of ongoing recession following the GFC4 lingered in the psyche of investors, paralyzing them from action. But valuations were very attractive on normalized results – especially in quality small and mid-caps – creating a favourable environment for active investors.

Compounding our experience and learned knowledge, we see many of those same market dynamics present today.

Step up to the plate.

We concluded our last commentary with a section titled the “Hitter’s count” – describing the positive set up we see for deploying capital. With many security prices down significantly over the last couple of years that set up is increasingly attractive today.

Taking advantage of fear does not mean we aren’t mindful of the present risks – but it is precisely because investors are focused on those risks that we find ourselves in this fertile investment environment.

Looking through any near-term market volatility we see strong performance coming from the companies we own materially re-rating, targeted catalysts occurring, and/or a wave of M&A as opportunistic acquirers step in to take advantage of significant value dislocations.

Thank you for your trust, patience, and confidence. Please don’t hesitate to reach out with any questions.

Sincerely,

Travis Dowle, CFA
President & Fund Manager
Maxam Capital Management Ltd.

1 Maxam Diversified Strategies Fund, Series F, net of fees and expenses. Please contact us regarding other classes of fund units or visit our website www.maxamcm.com. S&P/TSX Composite, S&P 500 Index and Bloomberg Aggregate Bond Index data sourced from Bloomberg.

2 Index performance data sourced from Bloomberg.

3 While AI is a legitimate growth area and opportunity for many businesses, the hype has created some inflated valuations. NVIDIA is a great company, but it might not trade at a great valuation today. Here’s an infamous quote from Scott McNeely, former CEO of Sun Microsystems, describing his company’s valuation during the technology and internet bubble that burst in 2000:

“At 10 times revenues, to give you a 10-year payback, I have to pay you 100% of revenues for 10 straight years in dividends. That assumes I can get that by my shareholders. That assumes I have zero cost of goods sold, which is very hard for a computer company. That assumes zero expenses, which is really hard with 39,000 employees. That assumes I pay no taxes, which is very hard. And that assumes you pay no taxes on your dividends, which is kind of illegal. And that assumes with zero R&D for the next 10 years, I can maintain the current revenue run rate. Now, having done that, would any of you like to buy my stock at $64? Do you realize how ridiculous those basic assumptions are? You don’t need any transparency. You don’t need any footnotes. What were you thinking?”

4 GFC is the acronym for the Great Financial Crisis circa. 2007-2008. https://en.wikipedia.org/wiki/2007–2008_financial_crisis

This information is intended to provide you with information about the Maxam Diversified Strategies Fund and is not an offer to sell or solicit. Disclosed performance is based on Class X, A and F units and is net of all fees and expenses. Inception date for Class X is June 30, 2009; Class A is December 31, 2012 and; Class F is January 31, 2013. The performance fees on Class X units are subject to a 5% annualized hurdle. Important information about the Fund is contained in the Simplified Prospectus and Fund Facts which should be read carefully before investing. Prior to August 24, 2022 this Fund was offered via Offering Memorandum only and was not a reporting issuer. Historical audited financial statements for this period are archived here. The expenses of the Fund would have been higher during such period had the Fund been subject to the additional regulatory requirements applicable to a reporting issuer. Prior to becoming a reporting issuer, the Fund was not subject to the investment restrictions and practices in NI 81-102. Important information about the Fund is contained in the Fund’s Simplified Prospectus, which should be read before investing. This presentation is neither an offer to sell securities nor a solicitation to sell securities. The securities of the Fund are sold only through IIROC registered dealers in those jurisdictions where it may be lawfully offered for sale. Accredited investors or certain other qualified investors may also purchase securities through Maxam Capital Management Ltd in reliance on certain prospectus exemptions available in National Instrument 45-106. Investors should consult with their own investment advisor and obtain a copy of our applicable Simplified Prospectus and Fund Facts documents before investing in the Fund. Investors should seek advice on the risks of investing in the Fund before investing. This document may contain forward-looking statements. These forward-looking statements are based upon the reasonable beliefs of Maxam Capital Management Ltd. at the time they are made and are not guarantees of future performance, are subject to numerous assumptions, and involve risks and uncertainties about general economic factors which may change over time. Maxam assumes no duty, and does not undertake, to update any forward-looking statement and cautions you not to place undue reliance on these statements as actual events or results may differ materially from those expressed or implied in any forward-looking statements made. Commissions, trailing commissions, management fees and expenses all may be associated with mutual fund investments. Please read the Simplified Prospectus before investing. Any indicated rates of return are the historical annual total returns including changes in value and reinvestment of all distributions and does not take into account sales, redemption, distribution or optional charges or income taxes payable by any unitholder that would have reduced returns. Mutual funds are not guaranteed, their values change frequently and past performance may not be repeated. This document is not intended to provide legal, accounting, tax or investment advice. Please consult an investment advisor and read the prospectus for the Maxam Diversified Strategies Fund prior to investing.

Maxam Arbitrage Fund – Q3 2023

Maxam Arbitrage Fund turns three years old.

Maxam Arbitrage Fund – Q3 2023 Commentary

Dear fellow investors,

The Maxam Arbitrage Fund1 gained +1.0%in the third quarter, +3.8% through the first nine months of 2023 and +6.0% over the last year.

Positive fund performance for the quarter was driven by the successful completion of 17 M&A deals and our SPAC holdings benefiting from liquidations, extensions, and the ongoing growth of cash held in-trust due to higher interest rates.

Rates and Regulators.

For several quarters now we have been highlighting the more hostile regulatory environment that many large capitalization mergers and acquisitions have faced, most notably from the FTC and DOJ in the U.S. We have recently seen some key setbacks and losses for regulators attempting to block deals – notable transactions where regulators were unsuccessful included: Black Knight/Intercontinental Exchange, Activision/Microsoft, and Horizon Therapeutics/Amgen.

These developments are encouraging for dealmakers and arbitrageurs, not just for the success of these specific deals but because established precedent and competition law is being upheld, and regulators may be deterred from readily challenging so many deals going forward.

In addition to more frequent regulatory challenges, higher interest rates have also been influencing the arbitrage environment. Constructively, higher interest rates have historically had a positive influence on arbitrage returns because arbitrage spreads typically reflect the prevailing risk-free rate plus a deal risk premia. And the low duration nature of the strategy helps us quickly take advantage of those attractive spreads as deals complete.

We have a tailwind at our backs today for future returns. We own, and are investing in, solid deals with arbitrage yields in the ~8-12% range.

The flow.

The recent market environment has been characterized by rising interest rates, tightening credit conditions, recession fears and geopolitical tensions. You wouldn’t be alone in questioning if these factors were problematic for deal flow.

Despite these factors, and a volatile market environment, we added over 60 new M&A deals to our arbitrage database in the third quarter alone (and we’ve already added 15 more in October so far).

We discussed reasons for the ebb and flow of deal activity in both our Q1 and Q2 commentaries. The quantum of deals, types of buyers, and the sectors that activity may be more concentrated in all tend to vary with the prevailing market and economic conditions – but historically we have always had sufficient deal flow to actively maintain our risk management framework.

In particular, with many quality small and mid-cap companies trading at material discounts to their larger peers, plus numerous busted IPOs and de-SPACs struggling to garner attention from investors, we foresee an environment where opportunistic acquirers are increasingly likely to step-up, enhancing deal flow.

The fund invested in 31 new or existing deals during the quarter, had 17 successful deal closures and experienced no deal breaks. Owned deals that successfully closed during the quarter included: US Xpress, Diversey Holdings, Berkshire Grey, Absolute Software, Univar Solutions, Reunion Neuroscience, Uni-Select Inc, Arconic Corp, Franchise Group, Focus Financial Partners, Conformis Inc, Home Capital, Quotient Technology, Radius Global Infrastructure, Reata Pharmaceuticals, Syneos Health and Liminal Biosciences.

At the end of the third quarter the fund held 33 merger arbitrage positions.

Special Purpose? How about Shrinking Pool of Acquisition Companies.

There were 330 publicly listed SPACs at the end of the quarter, down from over 530 at the end of 2022 – and similar to what has been transpiring for several quarters now most of this decrease came from liquidations rather than closed deals2. Also, the pace of new SPAC IPOs has largely ground to a halt, with September marking the first month in over a year without an offering3.

SPAC arbitrage is a shrinking opportunity set, but one that continues to provide us with an opportunity to earn very attractive risk-adjusted returns via liquidations and extensions. Recall that SPAC trust accounts are invested in T-bills and that SPAC sponsors are faced with either liquidating at maturity – and returning capital plus interest to investors – or offering incentives to shareholders, such as topping up trust accounts, to compensate them for staying invested for another few months. This risk/reward strikes us as quite attractive, especially when you consider that these returns are largely taxed as capital gains.

At the close of Q3, the fund was well-diversified across 76 SPACs.

Tailwinds.

As discussed above, higher interest rates have historically been a tailwind for arbitrage returns – this is evident in the attractive arbitrage yields available to us today. In addition to the current robust opportunity set of deals, we foresee an environment that is conducive to a continuation of healthy deal flow.

The Maxam Arbitrage Fund achieved its three-year track record milestone at the end of the third quarter. We are pleased with the fund’s strong results so far and look forward to continuing to deliver value-add with consistent performance that exhibits low correlation with traditional equities and bonds.

Thank you for your trust and confidence. Please don’t hesitate to reach out with any questions.

Sincerely,

Travis Dowle, CFA
President & Fund Manager
Maxam Capital Management Ltd.

1 Maxam Arbitrage Fund, Class F, net of fees and expenses. Inception date October 1, 2020. Please contact us regarding other series of fund units or visit our website www.maxamcm.com

2 SPAC stats from www.spacresearch.com

3 https://www.bnnbloomberg.ca/zero-spac-offerings-since-august-with-market-gone-cold-1.1979731

Maxam Capital Management Ltd. is the manager for the Maxam Arbitrage Fund. Important information about the Fund is contained in the Fund’s Simplified Prospectus, which should be read before investing. This presentation is neither an offer to sell securities nor a solicitation to sell securities. Disclosed historical returns for periods greater than one year are annualized unless otherwise noted and are net of fees and expenses. Commissions, trailing commissions, management fees and expenses all may be associated with mutual fund investments. Please read the Simplified Prospectus before investing. Any indicated rates of return are the historical annual total returns including changes in value and reinvestment of all distributions and does not take into account sales, redemption, distribution or optional charges or income taxes payable by any unitholder that would have reduced returns. Mutual funds are not guaranteed, their values change frequently, and past performance may not be repeated. This document is not intended to provide legal, accounting, tax, or investment advice. Please consult an investment advisor and read the prospectus for the Maxam Arbitrage Fund prior to investing. Please contact us for more information at: (604) 685-0201 info@maxamcm.com www.maxamcm.com

Maxam Diversified Strategies Fund – Q2 2023

Selectively optimistic. The hitter’s count.

Maxam Diversified Strategies – Q2 2023 Commentary

Dear fellow investors,

The Maxam Diversified Strategies Fund1 gained +1.4% in the month of June and finished the second quarter -2.6%.

Major market narratives so far in 2023 have included continued interest rate increases, a U.S. regional banking crisis, recession fears, the emergence of artificial intelligence as a FOMO2 inducing investment theme, and the narrow breadth of U.S. equity market strength.

After 10 consecutive interest rate hikes, the Federal Reserve left rates unchanged in June. While U.S. central bankers continue to project higher interest rates, they now appear more willing to wait to assess the impact of their hiking campaign on inflation and the economy. Canada’s central bank took a similar pause in January before raising again, citing tight labour markets and persistent inflationary pressures in services.

Promisingly, inflation has declined from high single-digit to mid-single digit levels over the last year or so – although it remains above target. And bellwether equity indices, most notably in the U.S., have continued to improve, perhaps sniffing out an end to this rate hiking cycle, with help from some AI hype and excitement.

However, the breadth of equity market leadership has been very narrow this year with the significant dominance of the magnificent seven – Apple, Microsoft, Google, Amazon, Meta, NVIDIA and Tesla. Case in point, the equal weighted S&P 500 was negative through the first five months of the year while the market cap weighted S&P 500 was up close to double digits. At the end of the second quarter the combined weight of these seven companies comprised almost 46% percent of the NASDAQ Composite Index3 and they traded at an average P/E ratio of 43x4.  

While narrow leadership from just the very largest companies can sometimes mask issues, it can, alternatively, also hide compelling opportunities. Encouragingly, market breadth has begun to improve over the last few weeks with positive price action starting to extend beneath the surface of the mega caps. We view this as a welcome development…and perhaps an inflection point for some unloved and/or ignored companies.

Climbing the wall.

In recent commentaries we have highlighted that investors have been ignoring certain segments of the market.  The apathy towards small and mid-cap companies, and to some sectors, is as significant as we have seen in several years, and this has led to some valuations that may already reflect a recessionary environment.

This dynamic is part of the compelling opportunity today:

  • Attractive valuations and growth prospects beneath the surface of the mega-caps.
  • Canadian equities are broadly more attractively valued than U.S. equities.
  • Select companies more than pricing in a recession in our opinion.
  • Small/mid-caps are much cheaper than large caps5.
  • Small caps typically outperform during periods of declining inflation and exiting recessions.
  • Select special situations offer compelling reward relative to risk.

We continue to see the environment shifting towards attractive value and fundamentals, and away from speculation and growth at any price.

Exposures.

At the end of the first quarter the fund was diversified across 11 industry sectors and its top 25 positions accounted for approximately 51% of net exposure. From a strategy perspective, fund exposures include 64% in fundamental longs, 21% in special situations, 4% in convertible debentures, 13% in arbitrage, and approximately 2% of gross exposure in short positions.

Positive contributors to fund performance during the first half of 2023 included H2O Innovation, The Westaim Corp, Sylogist, DRI Healthcare, Maxim Power, and Ag Growth International.

Our investments in H2O Innovation and Maxim Power are good examples of investing in unloved or ignored companies when there is a compelling reward to risk opportunity.

In our Q2 2022 commentary we stated that we had recently added to our position in H2O Innovation, a water infrastructure and technology company with highly recurring revenues and a growing backlog of business, at around $2 per share. In our view we were purchasing shares of a high-quality business that was trading at an unreasonably depressed share price. H2O’s price stayed depressed through the remainder of 2022 before it began to capture the attention of investors again. It closed at $3.20 per share on June 30.

Maxim Power, an independent power producer based in Alberta, was late in the process of commissioning an upgrade to its core electricity generating asset in Grand Cache, AB when it announced that a fire incident had occurred in late September 2022, potentially delaying operations. While we did not own shares in Maxim at the time, we were familiar with the company from a previous investment and able to act quickly on the opportunity. From mid-October 2022 to year end, we purchased shares of Maxim at prices largely between $3.40 to $3.60 per share with the view that proceeds from insurance coverage would see them through repairs and remaining commissioning. Maxim’s shares closed the second quarter of 2023 at $4.76 per share.

We believe we have more value and catalyst rich names like these in the fund today.

Hitter’s count.

The summer months are notoriously slow for the markets, and we don’t suggest it will be all smooth sailing ahead – after all, it is rarely a smooth ride for equities. We would describe our current outlook and actions as selectively optimistic.

Buying fear, and conversely selling exuberance, is hard to do, but history has repeatedly shown us that it is the best long-term approach. In a market environment where plenty of negative information has been priced into securities over the last 18 months, we see opportunity to deploy capital selectively, in specific companies trading at valuations where we believe the odds are stacked in our favour – the hitter’s count.

We are excited about the prospects for the remainder of 2023 and beyond – as much as we have been in several years.

Thank you for your trust and confidence. Please don’t hesitate to reach out with any questions.

Sincerely,

Travis Dowle, CFA
President & Fund Manager
Maxam Capital Management Ltd.

1 Maxam Diversified Strategies Fund, Series F, net of fees and expenses. Please contact us regarding other classes of fund units or visit our website www.maxamcm.com

2 Do we really still have to explain this one?! FOMO = Fear of Missing Out.

3 https://indexes.nasdaqomx.com/docs/FS_COMP.pdf

4 The “Magnificent Seven” traded at an average price to earnings multiple of 43x as at June 30, 2023 (source Bloomberg, 12/2023 analyst estimates). As a bonus, see chart below showing some relative valuations.

5 Here’s a chart showing P/E ratios for U.S. large caps and small caps over the last 10 years, plus the P/E ratio for the Magnificent Seven on June 30, 2023. As you can see, small caps have historically traded at a premium valuation to large caps, but today they are at a material discount.

This information is intended to provide you with information about the Maxam Diversified Strategies Fund and is not an offer to sell or solicit. Disclosed performance is based on Class X, A and F units and is net of all fees and expenses. Inception date for Class X is June 30, 2009; Class A is December 31, 2012 and; Class F is January 31, 2013. The performance fees on Class X units are subject to a 5% annualized hurdle. Important information about the Fund is contained in the Simplified Prospectus and Fund Facts which should be read carefully before investing. Prior to August 24, 2022 this Fund was offered via Offering Memorandum only and was not a reporting issuer. Historical audited financial statements for this period are archived here. The expenses of the Fund would have been higher during such period had the Fund been subject to the additional regulatory requirements applicable to a reporting issuer. Prior to becoming a reporting issuer, the Fund was not subject to the investment restrictions and practices in NI 81-102. Important information about the Fund is contained in the Fund’s Simplified Prospectus, which should be read before investing. This presentation is neither an offer to sell securities nor a solicitation to sell securities. The securities of the Fund are sold only through IIROC registered dealers in those jurisdictions where it may be lawfully offered for sale. Accredited investors or certain other qualified investors may also purchase securities through Maxam Capital Management Ltd in reliance on certain prospectus exemptions available in National Instrument 45-106. Investors should consult with their own investment advisor and obtain a copy of our applicable Simplified Prospectus and Fund Facts documents before investing in the Fund. Investors should seek advice on the risks of investing in the Fund before investing. This document may contain forward-looking statements. These forward-looking statements are based upon the reasonable beliefs of Maxam Capital Management Ltd. at the time they are made and are not guarantees of future performance, are subject to numerous assumptions, and involve risks and uncertainties about general economic factors which may change over time. Maxam assumes no duty, and does not undertake, to update any forward-looking statement and cautions you not to place undue reliance on these statements as actual events or results may differ materially from those expressed or implied in any forward-looking statements made. Commissions, trailing commissions, management fees and expenses all may be associated with mutual fund investments. Please read the Simplified Prospectus before investing. Any indicated rates of return are the historical annual total returns including changes in value and reinvestment of all distributions and does not take into account sales, redemption, distribution or optional charges or income taxes payable by any unitholder that would have reduced returns. Mutual funds are not guaranteed, their values change frequently and past performance may not be repeated. This document is not intended to provide legal, accounting, tax or investment advice. Please consult an investment advisor and read the prospectus for the Maxam Diversified Strategies Fund prior to investing.

Maxam Arbitrage Fund – Q2 2023

Higher interest rates lead to more attractive arbitrage yields.

Maxam Arbitrage Fund – Q2 2023 Commentary

The Maxam Arbitrage Fund1 gained +1.1%in the second quarter and is up +2.7% through the first six months of 2023. The S&P Merger Arbitrage Total Return Index gained +0.3% in Q2 and is down -1.2% year to date.

Positive fund performance in the quarter was buoyed by the successful completion of 12 M&A deals and our SPAC holdings benefiting from liquidations, extensions, and the ongoing growth of cash held in-trust due to higher interest rates.

Ebb and flow.

The arbitrage opportunity set continues to be heavily influenced by today’s higher interest rates and the ongoing and increased scrutiny that the FTC under the Biden administration, and certain other foreign regulators, are applying to select transactions – most notably to larger capitalization deals.

In the second quarter we saw the UK’s Competition and Markets Authority (CMA) move to block the Activision/Microsoft deal, the termination of the First Horizon/TD Bank deal after the parties failed to obtain regulatory approval, Canaccord’s failed management buyout, and the FTC seeking to block Amgen’s acquisition of Horizon Therapeutics with a novel and untested theory of harm.

Higher interest rates and a challenging regulatory environment have almost certainly led to a slowdown in large cap transactions in recent months. As we highlighted in our Q1 commentary, we continue to see a barbell of return opportunity and risk across two broad groups of deals. Large and mega-cap transactions typically face higher regulatory and duration risk, whereas small and mid-capitalization deals usually do not face the same regulatory risk, plus they close more quickly and often trade at higher gross spreads.

With risk management core to our process, we continue to deploy capital into an attractive opportunity set across the market capitalization spectrum and characterized by deals with arbitrage yields in the high single digit to low double-digit range.

The fund invested in seven new deals during the quarter, had 12 successful deal closures and experienced one deal break (a small position in First Horizon). Owned deals that successfully closed during the quarter included: Shaw Communications, Provention Bio, Yamana Gold, Magnet Forensics, Oak Street Health, Maxar Technologies, TravelCenters of America, E Automotive, Qualtrics International, Indus Realty Trust and Bellus Health.

At the end of the second quarter the fund held 24 merger arbitrage positions.

Gather up your jackets, move it to the exits2.

The SPAC universe continues to be largely in a state of run-off. At the end of the second quarter there were 391 listed SPACs down from over 530 at the end of 2022 – most of the decrease came from liquidations rather than closed deals; and the pace of new SPAC IPOs continued to slow with only six during the quarter3.

We continue to take advantage of SPAC liquidations and extensions with our systematic and quantitative process – recall that SPAC sponsors are faced with either liquidating at maturity and returning capital to investors or offering incentives to shareholders to encourage them to stay invested for another few months, such as topping up trust accounts.

In addition to liquidations and extensions, we have also identified several unique opportunities where we believe we have exposure to some interesting upside optionality.

SPACs continue to present us with the prospect of earning annualized returns in the mid-to-high single digit range on securities that are backed by T-bills held in trust. This risk/reward strikes us as quite attractive, especially when you consider that these returns are largely taxed as capital gains.

As of June 30 the fund was well-diversified across 51 SPACs.

Every new beginning comes from some other beginning’s end4.

When one deal closes, we receive and redeploy the proceeds into another deal to further compound that capital – a key and attractive characteristic of the strategy. Thus, new M&A activity is important.

We are mindful of the impact that an environment of higher interest rates and tighter credit conditions can have on deal flow. As a result, we may see fewer large and mega cap transactions, especially given the more hostile regulatory environment towards such deals.

Despite the natural ebb and flow of capital markets activity – through bull markets, bear markets, recessions, and geopolitical events – the quantum of overall deal activity through various cycles has historically enabled arbitrageurs to construct a well-diversified portfolio.

Constructively, and as mentioned earlier, we foresee an increasing opportunity in small and mid-cap deals where regulatory risks are much lower. These deals also tend to close more quickly than their larger cap brethren and often trade at more attractive arbitrage yields due to larger pools of capital not being able to allocate efficiently to them.

With many quality small-caps trading at steep discounts to their larger peers, plus numerous busted IPOs and de-SPACs getting no love from investors, opportunistic acquirers are increasingly likely to step-up. We will continue to allocate actively and selectively to this attractive segment of the arbitrage opportunity set.

Looking ahead.

Merger arbitrage spreads are attractive right now – both on an absolute and relative basis – presenting investors with an opportunity to earn returns from a strategy that exhibits low correlation with traditional equities and bonds.

Higher interest rates have historically been a positive factor for arbitrage returns because arbitrage spreads in essence reflect the prevailing risk-free rate plus deal risk premia. And the low duration nature of the strategy helps us quickly take advantage of those attractive spreads as deals complete.

We continue to navigate and deploy capital into an attractive opportunity set with our quantitative, data-centric and risk management focused investment process.

Thank you for your trust and confidence. Please don’t hesitate to reach out with any questions.

Sincerely,

Travis Dowle, CFA
President & Fund Manager
Maxam Capital Management Ltd.

1 Maxam Arbitrage Fund, Class F, net of fees and expenses. Inception date October 1, 2020. Please contact us regarding other series of fund units or visit our website www.maxamcm.com

2 Lyrics from ‘Closing Time’ by Semisonic – nominated for the best rock song Grammy in 1999. https://en.wikipedia.org/wiki/Closing_Time_(Semisonic_song)

3 SPAC stats from www.spacresearch.com

4 Another great lyric from ‘Closing Time’ (see footnote 2 above). For us this lyric signifies part of the attractiveness of an arbitrage strategy – when a deal closes, we receive the proceeds and invest them into another new deal to further compound that capital. And on it goes!

Maxam Capital Management Ltd. is the manager for the Maxam Arbitrage Fund. Important information about the Fund is contained in the Fund’s Simplified Prospectus, which should be read before investing. This presentation is neither an offer to sell securities nor a solicitation to sell securities. Disclosed historical returns for periods greater than one year are annualized unless otherwise noted and are net of fees and expenses. Commissions, trailing commissions, management fees and expenses all may be associated with mutual fund investments. Please read the Simplified Prospectus before investing. Any indicated rates of return are the historical annual total returns including changes in value and reinvestment of all distributions and does not take into account sales, redemption, distribution or optional charges or income taxes payable by any unitholder that would have reduced returns. Mutual funds are not guaranteed, their values change frequently, and past performance may not be repeated. This document is not intended to provide legal, accounting, tax, or investment advice. Please consult an investment advisor and read the prospectus for the Maxam Arbitrage Fund prior to investing. Please contact us for more information at: (604) 685-0201 info@maxamcm.com www.maxamcm.com

Maxam Diversified Strategies Fund – Q1 2023

A market in transition. Investing in attractive value and special situations.

Maxam Diversified Strategies – Q1 2023 Commentary

Dear fellow investors,

The first quarter of 2023 started well with equity markets moving higher in January before giving back some gains through February. March was a particularly volatile month driven by concern that a regional banking crisis in the U.S. may be unfolding – however regulators acted swiftly to calm depositor and investor fears.

Against this backdrop, the Maxam Diversified Strategies Fund1 was little changed in the first quarter at -0.2%.

Capital has a cost again.

Inflation has declined from high single-digits to mid-single digits following a series of rapid interest rate increases over the last ~14 months. Canada’s central bank has now signaled that it is in ‘pause’ mode with respect to further hikes as it awaits more data. In the U.S., despite the Federal Reserve continuing to assert a more hawkish tone, markets are expecting a pause later this year, and perhaps even a pivot lower.

Constructively, we are encouraged that central bankers now have room to maneuver policy rates in response to any unforeseen developments – a luxury of flexibility that they did not enjoy a year ago. However, despite the relief that high multiple growth stocks and speculative companies have experienced of late thanks to shifting rate expectations, we continue to see many companies in that expensive cohort trading at valuation levels that will be difficult to sustain.

Even if we do get a pause that transitions into a pivot lower for interest rates, we do not see a return to the near nil levels that prevailed from late 2008 to early 2016, and for the two years following the onset of the COVID-19 pandemic. We have noted in recent commentaries that capital has a cost again – and this continues to shape our outlook and inform us where we see value, opportunity, and risk.

Most notably, we foresee the reality that capital has a cost again increasingly focusing investor attention on valuation and company-specific fundamentals.

We like growth, but we want to pay a reasonable price for it.

Everyone is talking about it.

It is no secret that a concentrated group of the largest and best-known companies have played a significant role in moving the bellwether equity indices ahead of late. In turn, investors have ignored other segments of the market, resulting in a fertile investment environment beneath the surface of the mega-caps. The chart below compares the price-to-earnings ratio of large caps versus small caps over the last 10 years, and for fun we throw in the average P/E ratio for some familiar mega-cap companies.

While small capitalization companies have historically traded at premium valuations to large caps due to their faster growth rates, on average they trade at a material discount today.

Investors have sought safety in the largest capitalization companies and likely shied away from smaller caps as a group because of the perception that these businesses are more sensitive to higher interest rates (they are growth companies) and at greater risk during recessionary environments. While that perception may be true on average, the averages obscure specific opportunities.

While many of our holdings are not your typical household names, they are businesses where we have identified attractive value and growth, or an upcoming event or catalyst that we believe will drive future gains. And in many cases, market concerns over slowing growth and recession are more than reflected in their current share prices.

In addition to attractive growth prospects and valuations, our holdings largely reflect our preference for solid balance sheets and stable business models. In an environment where interest rates have risen dramatically from levels experienced in recent years, a business with low debt levels, or perhaps no debt at all, is much less likely to face financial stress from a need to refinance at higher prevailing rates.

While it has been a particularly challenging period for small and mid-caps recently, we are encouraged by the discounted valuations and significant opportunities we are invested in and deploying capital into today.

Exposures.

The fund was invested across all 11 industry sectors with the top ten positions accounting for 28% of net exposure as at the end of the first quarter. From a strategy perspective, fund exposures include 67% in fundamental longs, 21% in special situations, 4% in convertible debentures, 15% in arbitrage, and approximately 2% of gross exposure in short positions.

As noted above, the fund’s exposure to arbitrage was approximately 15% at the end of the first quarter. This is down from 31% at the end of 2022 as a result of tactically re-allocating capital to select fundamental longs and special situations where we see compelling risk/reward attributes.

Select positive contributors to fund performance during the first quarter included Vecima Networks, Ag Growth International and Guardian Capital Group. Individual holdings detracting from results in the quarter included Knight Therapeutics, Chemtrade Logistics and Tidewater Midstream & Infrastructure.

Hindsight has a perfect track-record.

Looking backwards it is easy to explain what happened – and it makes perfect sense that it did. Looking forward is the hard part.

We often ask ourselves: “looking backwards two years from today, what will seem obvious in hindsight?

Today we observe a market environment that has, at times, seemed solely focused on top-down, macroeconomic concerns. We believe the market is fairly efficient at discounting these factors as they become understood and well known. However, in our experience the market tends to be much less efficient with respect to discounting both risk and opportunity for individual companies – especially in the less well-covered arena of small and mid-caps.

In our Q4 2022 commentary we outlined that we have historically delivered some of our best performance after periods of elevated market volatility and market declines (review that detail here). With many security prices still down significantly over the last 18 months, it has most certainly become a more fertile investment environment for our investment style and strategy.

When we look back a couple of years from now, with the benefit of hindsight, I think it will make sense that we were investing in businesses with strong fundamentals and attractive valuations that were being largely ignored by the market. And I think we’ll be quite pleased.

While there are no straight lines, we are excited about the prospects for the remainder 2023 and beyond – as much as we have been in several years.

Thank you for your trust and confidence. Please don’t hesitate to reach out with any questions.

Sincerely,

Travis Dowle, CFA
President & Fund Manager
Maxam Capital Management Ltd.

1 Maxam Diversified Strategies Fund, Series F, net of fees and expenses. Please contact us regarding other classes of fund units or visit our website www.maxamcm.com

This information is intended to provide you with information about the Maxam Diversified Strategies Fund and is not an offer to sell or solicit. Disclosed performance is based on Class X, A and F units and is net of all fees and expenses. Inception date for Class X is June 30, 2009; Class A is December 31, 2012 and; Class F is January 31, 2013. The performance fees on Class X units are subject to a 5% annualized hurdle. Important information about the Fund is contained in the Simplified Prospectus and Fund Facts which should be read carefully before investing. Prior to August 24, 2022 this Fund was offered via Offering Memorandum only and was not a reporting issuer. Historical audited financial statements for this period are archived here. The expenses of the Fund would have been higher during such period had the Fund been subject to the additional regulatory requirements applicable to a reporting issuer. Prior to becoming a reporting issuer, the Fund was not subject to the investment restrictions and practices in NI 81-102. Important information about the Fund is contained in the Fund’s Simplified Prospectus, which should be read before investing. This presentation is neither an offer to sell securities nor a solicitation to sell securities. The securities of the Fund are sold only through IIROC registered dealers in those jurisdictions where it may be lawfully offered for sale. Accredited investors or certain other qualified investors may also purchase securities through Maxam Capital Management Ltd in reliance on certain prospectus exemptions available in National Instrument 45-106. Investors should consult with their own investment advisor and obtain a copy of our applicable Simplified Prospectus and Fund Facts documents before investing in the Fund. Investors should seek advice on the risks of investing in the Fund before investing. This document may contain forward-looking statements. These forward-looking statements are based upon the reasonable beliefs of Maxam Capital Management Ltd. at the time they are made and are not guarantees of future performance, are subject to numerous assumptions, and involve risks and uncertainties about general economic factors which may change over time. Maxam assumes no duty, and does not undertake, to update any forward-looking statement and cautions you not to place undue reliance on these statements as actual events or results may differ materially from those expressed or implied in any forward-looking statements made. Commissions, trailing commissions, management fees and expenses all may be associated with mutual fund investments. Please read the Simplified Prospectus before investing. Any indicated rates of return are the historical annual total returns including changes in value and reinvestment of all distributions and does not take into account sales, redemption, distribution or optional charges or income taxes payable by any unitholder that would have reduced returns. Mutual funds are not guaranteed, their values change frequently and past performance may not be repeated. This document is not intended to provide legal, accounting, tax or investment advice. Please consult an investment advisor and read the prospectus for the Maxam Diversified Strategies Fund prior to investing.

Maxam Arbitrage Fund – Q1 2023

An eventful quarter with 17 transaction closures and one deal bump.

Maxam Arbitrage Fund – Q1 2023 Commentary

Dear fellow investors,

The Maxam Arbitrage Fund1 gained +1.6%in the first quarter of 2023 whereas the S&P Merger Arbitrage Total Return Index declined -1.5%.

The Maxam Arbitrage Fund’s goal is to profit regardless of the behaviour of the markets, and we’re pleased that the fund delivered a positive return in each of the first three months of 2023.

Fund performance was generated from the successful completion of 17 merger arbitrage deals during the quarter, and our SPAC arbitrage holdings benefiting from liquidations, extensions, and ongoing accretion to NAV.

An eventful quarter.

Despite a volatile market environment during the first quarter – most notably during March when U.S. regional banks came under significant pressure, impacting the general market – existing and new deals continued to provide us with an attractive arbitrage opportunity set in which to deploy capital.

Merger arbitrage spreads are attractive today – both on an absolute and relative basis. Higher interest rates have historically been a positive for arbitrage returns because, at a high level, arbitrage spreads reflect the prevailing risk-free rate and deal risk premia.

We are seeing a bit of a barbell across two broad groups of deals today. While the average merger arbitrage spread across the universe we track is in the low double-digit range, that statistic is pulled higher by some of the riskier transactions with very high yields (think regulatory and financing risks). Conversely, we are seeing an attractive cohort of relatively safer deals with arbitrage yields in the 7-9% range.

The fund invested in 14 new deals during the first quarter, had 17 successful deal closures and experienced no deal breaks. At the end of the quarter the fund held 23 merger arbitrage positions, diversified across market cap, deal type and industry.

Some notable merger arbitrage deals that contributed to gains during the quarter included Shaw Communications receiving final approval, a deal bump for Noranda Income Fund and narrowing of the Activision Blizzard spread.

Owned deals that successfully closed during the quarter included: Sierra Wireless, Freshii, Summitt Industrial Income REIT, STORE Capital, Cowen, Evo Payments, 1Life Healthcare, LHC Group, Noranda Income Fund, Smart Employee Benefits, Nuvo Pharmaceuticals, Waterloo Brewing, Coupa Software, Signify Health, Atlas Corp, and Atlas Air Worldwide.

State of the M&A market.

The types of deals – strategic, leveraged buyouts, opportunistic – and the sectors in which deal activity occurs, tend to vary with the prevailing market and economic environment. While the quantity of new transactions has slowed somewhat from last year, we are encouraged by the ongoing pace and breadth of new deal announcements. Historically there has been sufficient mergers and acquisitions activity through market cycles to construct a diversified portfolio.

As we’ve highlighted in recent commentaries, protracted regulatory reviews continue to be common, especially under the Biden administration. Scrutiny has focused on larger cap transactions and industries deemed more sensitive to competition concerns – notably health care, technology, and financial services. While success from the regulators’ perspective has been mixed at best, reviews and challenges have resulted in some longer deal timelines.

Microsoft’s January 2022 agreement to acquire Activision Blizzard for US$69 billion is being challenged by the Federal Trade Commission and other regulators. Two deals in the financial services sector – TD Bank’s acquisition of First Horizon Corporation and Madison Dearborn Partners’ acquisition of MoneyGram International – were both announced in February 2021 and have yet to receive their respective regulatory approvals over a year later.

Up here in Canada, Rogers Communications’ acquisition of Shaw Communications was announced in March 2021 and took just over two years to complete. The transaction received final approval on March 31st after a lengthy challenge from Canadian regulators that included an unsuccessful attempt by the Competition Bureau to block the merger.

Regulatory-challenged deals present both risk and opportunity – spreads are typically wider, however there can be greater risk of a deal break, or of lower annualized returns. These deals can present opportunity for active arbitrageurs as time passes and developments occur. For example, below is a chart of Shaw’s stock price through the duration of the deal timeline.

Beneath the surface.

While the largest M&A transactions get all the headlines, we often see more attractive risk-adjusted returns in small/mid cap deals. This is an opportunity set within the arbitrage universe that we actively allocate to.

Regulatory risks can be lower, or even non-existent, in smaller capitalization deals where competition concerns are much less significant and therefore may not meet review thresholds for anti-trust regulators. Not only do these deals tend to close more quickly than larger cap transactions, but they can also trade at higher gross spreads due to larger pools of capital not being able to allocate efficiently to them.

Small/mid cap deal flow can also be more consistent than their large cap brethren because, owing to their smaller size, they are often less dependent on the availability of external financing – if any is required.

We also observe greater upside optionality in the form of deal bumps and competitive situations in the small and mid-cap deal space. Case in point, diversified natural resources giant Glencore PLC recently increased its bid to acquire Noranda Income Fund from an initial price of $1.42 to $1.98 – a 39% bump – in response to some shareholders who asked for greater value. We were pleased to be long Noranda.

We believe we will continue to have the opportunity to allocate to attractive small/mid cap arbitrage situations in the current and approaching market environment. With many smaller cap companies trading at steep discounts to their larger and better capitalized peers, plus numerous busted IPOs and de-SPACs getting no love from investors, opportunistic acquirers are likely to step-up, as we are already seeing.

SPAC landscape.

While the environment for SPACs continued to evolve in the first quarter of 2023, we were still presented with opportunities to harvest attractive returns with very low risk exposure.

The SPAC universe continues to largely be in run-off with the large number of SPACs that came public via IPOs in 2021 now coming towards the end of their lives. SPAC sponsors are faced with either liquidating and returning capital or offering incentives for SPAC shareholders to stay long for another few months by topping up trust accounts. Both scenarios provide opportunities for arbitrageurs.

Our systematic and quantitative approach to SPAC arbitrage has enabled us to take advantage of both liquidations and extensions at attractive yields in the 6-7% range and sometimes higher. And, as a bonus, the higher interest rates earned by funds held in trust provides ongoing growth in SPAC NAVs.

We’ve also seen a small uptick in new SPAC issuance of late. New SPAC IPOs are typically coming with attractive features such as over-funded trust accounts and greater warrant coverage.

The prospect of earning annualized returns in the mid-to-high single digit range with T-bill level risk, taxed as capital gains, strikes us as attractive – especially relative to similar return alternatives.

As of March 31 the fund was well-diversified across 62 SPACs.

Looking ahead.

Merger arbitrage and SPAC arbitrage yields both benefit from higher interest rates, and we continue to see and deploy capital into a diversified portfolio of attractive risk-adjusted return opportunities across the capitalization spectrum.

Regardless of deal size, we are always focused on transactions that we believe will reach successful completion, bolstered by our systematic and risk management focused process.

Thank you for your trust and confidence. Please don’t hesitate to reach out with any questions.

Sincerely,

Travis Dowle, CFA
President & Fund Manager
Maxam Capital Management Ltd.

1 Maxam Arbitrage Fund, Class F, net of fees and expenses. Inception date October 1, 2020. Please contact us regarding other series of fund units or visit our website www.maxamcm.com

Maxam Capital Management Ltd. is the manager for the Maxam Arbitrage Fund. Important information about the Fund is contained in the Fund’s Simplified Prospectus, which should be read before investing. This presentation is neither an offer to sell securities nor a solicitation to sell securities. Disclosed historical returns for periods greater than one year are annualized unless otherwise noted and are net of fees and expenses. Commissions, trailing commissions, management fees and expenses all may be associated with mutual fund investments. Please read the Simplified Prospectus before investing. Any indicated rates of return are the historical annual total returns including changes in value and reinvestment of all distributions and does not take into account sales, redemption, distribution or optional charges or income taxes payable by any unitholder that would have reduced returns. Mutual funds are not guaranteed, their values change frequently, and past performance may not be repeated. This document is not intended to provide legal, accounting, tax, or investment advice. Please consult an investment advisor and read the prospectus for the Maxam Arbitrage Fund prior to investing. Please contact us for more information at: (604) 685-0201 info@maxamcm.com www.maxamcm.com